
The phrase refers to a graph that shows the levels of carbon dioxide (CO2) in the atmosphere from 1958 to the present. These measurements were started by Charles David Keeling at the Mauna Loa Observatory in Hawaii and have been continued by his son, Ralph. Keeling worked with the Scripps Institution of Oceanography at University of California at San Diego on these measurements. As reflected in the graph (below) there has been a steady rise in levels of CO2 from about 315 parts per million (ppm) in 1958 to over 400 ppm at present. Other research has demonstrated that in the pre-industrial period, from 1000 to 1750, levels of CO2 ranged from 275 to 285 ppm.
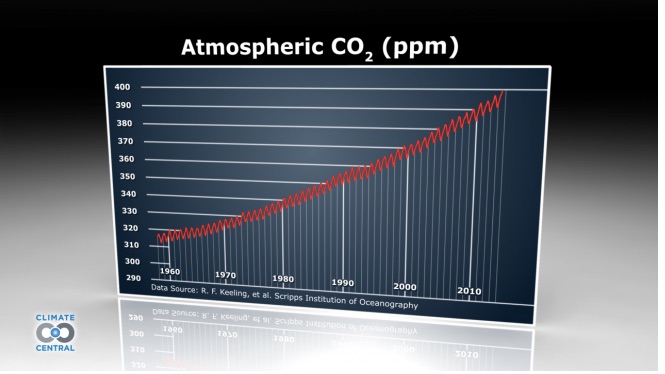
The zigzag on the curve represents the seasonal change in levels of CO2. Levels rise in the fall and winter when plants and leaves die off releasing CO2 into the atmosphere, causing a spike in the measurements, and levels fall during the spring and summer when plants draw CO2 from the atmosphere. These fluctuations occur only in the northern hemisphere where the Observatory is located.
The measurements from the Mauna Loa Observatory are considered reliable for global trends because the facility is located in the middle of the Pacific Ocean at 11,000 feet above sea level and not subject to emissions from factories or forests or other activities that might otherwise produce local effects on the measurements.
Daily updates on the global levels of CO2, as measured at Mauna Loa, are available on Twitter at twitter.com/keeling_curve
Some further ideas to explore on Keeling Curve
Where else in the world are measurements being collected for levels of CO2 and do they support the data from the Hawaii observatory?
Are measurements taken outside the northern hemisphere different from those in Hawaii because of the lack of seasonal fluctuations?
What is the role of the Keeling Curve in the discussions about climate change?
Sources
Scripps Institution of Oceanography at University of California at San Diego, The Keeling Curve scripps.ucsd.edu/programs/keelingcurve/
Climate Central, “Keeling Curve.” www.climatecentral.org/gallery/graphics/keeling_curve
Marc Lallanilla, “What is the Keeling Curve?” live science (2 May 2013). www.livescience.com/29271-what-is-the-keeling-curve-carbon-dioxide.html
“The Keeling Curve Explained,” QUEST/KQED (12 Dec 2014). science.kqed.org/quest/2014/12/12/the-keeling-curve-explained/
No comments yet, add your own below