ieBlog

London Fog 1952

On the 70 anniversary of the Fog

THE MOST UNUSUAL fact about the London Fog of 1952 was not that some 4,000 people died of it—one of the largest numbers of people killed by any environmental disaster—but that no one seemed to recognize that it was happening. Everyone knew, of course, that for four days the fog was so thick that traveling throughout the city was almost impossible. Few realized, however, just how deadly it was. After all, London had been notorious for its fog for a very long time. Romantic notions were attached to the fog, with events in many a thriller and period novel set amidst fog-bound London. For the residents of London, the fog was a frequent, if unwelcome, guest who was becoming a bit of a nuisance.

In 1952, when the fog hit, Londoners were relying heavily on soft, bituminous coal for fuel. The soft coal was cheap, in part because of the low cost of shipping it by sea from Newcastle, but it had a higher sulfur and nitrogen oxide content than the harder anthracite coal used in Wales and Scotland. The smoke it emitted was tarry and full of hydrocarbons.

When carbon particles of soot from coal-fire emissions combine with particles of water, fog becomes smog. The soot and water combination is not transparent to light, and as the fog thickens, light is prevented from penetrating through the foggy air. The sooty air is like the layer of black that gathers on the glass chimneys of oil lamps. Visibility is limited, and the breath one takes carries with it carbon particles and other dangerous substances.

Certain weather conditions, particularly temperature inversions, aggravate fog. Usually the air near the ground is warmer than air higher up, and the warm air rises and mixes with cooler air. Occasionally this relation is inverted with colder air remaining close to the ground and warmer air above, trapping the colder air on the ground. If there is little or no wind, the air becomes stagnant and anything in that air, such as soot, remains suspended.

During the nineteenth century, clean-air advocates attempted to address the emissions from factories and other businesses that contributed much of the soot. Eventually, they met with some success as legislation was passed making it a nuisance for a chimney to emit black smoke from a commercial establishment. Yet, enforcement was difficult and sporadic, especially with regard to proving what constituted black smoke.

The smoke from domestic hearths remained uncontrolled. One problem in regulating domestic sources was the lack of alternative, smokeless fuel supplies. Just as difficult an obstacle was the English fascination with a “pokeable” open fire. It was considered a national entitlement to make an open-hearth fire, and it was a sign of affluence, as well as of hospitality, to have a blazing hearth. By the first few decades of the twentieth century, those pokeable, domestic fires, along with industrial emissions, dumped some 76,000 tons of soot on London each year, the equivalent of about 650 tons for every square mile. About two-thirds of the smoke in London came from domestic fires. During World War II, the government even actively encouraged businesses to pollute as military authorities thought the smoke would serve as camouflage and make it more difficult for the German bombers to see their targets.

After the war, the fog remained an accepted aspect of living in London. In December 1952, however, a dense fog descended on London and stayed for four days. Earlier that December, a number of events had distracted Londoners from the typical cold, wet winter weather. The London papers were filled with reports on the plans for the coronation of Queen Elizabeth II that had been scheduled for June 1953. People were looking forward to Elizabeth’s first Christmas message. Christmas lights softened the cold, damp nights. Many looked forward to the Smithfield Show of prize cattle, sheep, and pigs, and agricultural machinery. The show, which took place in Earl’s Court, had been a major event since the eighteenth century, attracting a crowd from throughout England and abroad. The highlight of the show was the auction of the finest stock to butchers, a measure of pride for those who esteemed traditional English roast beef.

These distractions, however, could not entirely eliminate the weather. In the first few days of December, London experienced its typical climate: cold, damp air with some clearing spells, followed by fog or rain or snow. Often, the entire pattern—cold, clearing, rain, snow, and fog—occurred daily. During the first week of December, fog dominated.

By Thursday evening, December 4, a high-pressure system settled over London, and a temperature inversion trapped in the fog throughout the area. By Friday morning, tons of carbon particulate and sulfur dioxide poured out of millions of domestic coal fires and industrial plants into the still, foggy air over London. The temperature inversion prevented the dispersal of the fog into the upper air and trapped the smoke and other pollutants at ground level. Smoke that escaped from the tall stacks of the manufacturing plants fell to the ground rather than rising into the air.

On Friday, the fog and smoke covered much of London. A visitor staying in a warm, dry hotel with nothing to do might have found the fog on that first full day to be charming. Those who had to go to work did not. In the morning, people could see the outlines of buildings from a distance of only seventy to eighty yards; by noon, the large sculptural figure atop Nelson’s Column on Trafalgar Square was barely visible. Around Parliament, visibility was limited to a dozen yards. By noon, streetlamps had to be lit. With visibility along the Thames at zero, the Port of London was forced to close. Airports also closed. As the day wore one, travel became increasingly difficult. Buses everywhere in London experienced serious delays.

The color of the fog was not the usual gray but rather black, or at times yellow. As evening fell, the Christmas lights in store windows looked eerily suspended in open air since the stores themselves could not be seen from a short distance. Flares were placed at intersections for the vehicles still on the streets. People groped along buildings, stumbled over curbs and each other, and when they arrived home found they were covered with soot. Those who had meetings on Friday evening realized that the fog was seeping inside.

More disturbing than the impaired visibility was the difficulty in breathing, especially for older people and those with bronchitis. The smell of sulfur permeated the air. Noses stung, throats felt tight; people coughed up blackness.

When people awoke on Saturday morning the fog was everywhere, yellow and thick. It extended over an area of 1,000 square miles (2,590 m2) around London. Very few buses operated. At one point, seventeen buses formed a caravan to try to find their way back to the garage. The famous red double-decker buses inched along, bumper-to-bumper, with conductors leading the way by walking in front with flares, shouting directions. Ambulances traveled the same way. The fog infiltrated the tube stations. At one station, a bride and groom were waiting for a train to take them to their reception, since they had to abandon street-level transport. The bride’s wedding gown was black from the soot in the air. Sporting events were cancelled, and the unloading of livestock at the Smithfield Show was delayed. By Saturday evening, the fog followed people inside, through open doors, down chimneys, through cracks in walls, floors, and windows. Hospitals began to fill up. Yet by late Saturday, the BBC was reporting only that the fog might persist. No emergency had been declared.

On Sunday, with no break in the conditions, everything was blackened, inside as well as outside. Visibility remained at a few yards. Ambulances ran out of flares. With so many patients needing assistance the ambulances began to carry several on each trip to the hospital. On one trip, an ambulance that had been dispatched to carry four patients to a hospital ended up taking them all to the mortuary instead.

The elderly and sick, especially those living alone, were increasingly isolated during the fog. They could not get out, and if they did they could hardly breathe. As one elderly patient described it:

It makes you feel certain that you’re going to die, that death is surely coming for  you, partly because of your difficulty in breathing and partly because of the fierce  pain in your throat and lungs…and adding to your terror is the sight of the fog, when you see it there all around you, like some kind of gray, obscene animal, outside your window, drifting, floating, almost looking in at you, as though it were waiting there to claim you, to seize you, to choke you…to squeeze the breath, the very life out of your body.[1]

On Monday, the fourth full day of the fog, forecasts suggested that the fog might be lifting, but the forecasts were wrong. While air west of London cleared some, conditions over the city remained stagnant. An Aberdeen-Angus cow at the Smithfield Show died from the polluted air. The other cattle were saved by penicillin and whiskey-soaked rags that were held over their nostrils. Vehicles were abandoned all over the city.

In the Underground, the only viable means of transportation, long lines formed at the ticket booths. A performance of Verdi’s opera, La Traviata, was cancelled after the first act because fog inside the theater made the stage invisible. Early in the evening, the BBC broadcast that the fog was dirtier than usual and that coal-burning domestic fires were partly to blame. The item was deleted, however, from later broadcasts.

Finally, on early Tuesday morning, December 9, a slight breeze blew across London and the fog began to lift. By 9:00 a.m., the Thames cleared of fog, and the port reopened. More than one hundred ships waited to leave the port; over 200 ships waited to get in. The city began to breathe more easily.

The disruption of travel and sporting events, along with the impact of the fog on prize cattle in the Smithfield Show, dominated coverage in the papers. In the days following the lifting of the fog, letters to The Times debated only the economic benefits of electric versus coal heat. Few recognized the environmental or health hazards of the fog.

Soon, however, its human costs became visible. Doctors reported significant increases in respiratory disorders over previous winters. During the fog, hospitals around the city experienced a rise in emergency admissions, especially for respiratory ailments. The hospitals remained filled for days even after the clearing.

By mid-December the papers reported that as many as 1,000 Londoners had died as a result of the fog. Questions were raised in Parliament, and the Health Minister responded that there the deaths attributable to the fog may have been as many as 3,000. Smoke abatement advocates demanded an investigation. The government resisted. Harold MacMillan, then a Cabinet minister, remarked in private that they should form some committee that would do little, but would appear busy, in an effort to calm the public. It was not enough. In turn, the air pollution committee in Parliament, named after its chairman, Sir Hugh Beaver, addressed the matter with all due seriousness. The Beaver Committee published several interim reports that castigated both the local and national governments for failing to take preventive measures to protect the public. The committee also laid blame on domestic consumers as the largest producers of smoke and recommended the limit of smoke from all chimneys, both industrial and domestic, the production of greater supplies of smokeless fuel, and the establishment of smokeless zones in urban areas.

In January 1954, an article in the respected British Medical Journal estimated that the fog had caused over 4,500 deaths. That same year, the Ministry of Health produced a report that analyzed the effects of the fog. The government recognized that throughout those early days of December the metropolis of 8.5 million people was hardly aware that a disaster was occurring. The residents were also unaware that the aftereffects had continued to affect the city for several weeks. Dark smoke was detected as high as 4,500 micrograms per cubic meter and sulfur dioxide as high as 3,700—concentrations five to ten times normal levels. The report indicated that over 150 cattle at the Smithfield Show had received treatment, one had died and twelve were slaughtered. Autopsies of the cattle revealed emphysema and pneumonia.

The Ministry of Health concluded that as many as 4,000 people had died in excess of what would normally have occurred in the first three weeks of December, and that these deaths were caused by the fog, and in particular its tarry particles and sulfur oxides. The deaths were concentrated among people with pre-existing respiratory or cardiac disorders, and the vulnerable, those over sixty-five years and under one year old. The source of the contaminants was identified as irritants derived from the combustion of coal.

The report suggested that many of those who died from the fog likely experienced premature deaths. That is, the fog merely hastened the death of many who already had been suffering and were expected to die within a short time anyway. Some have referred to this concept as short-term mortality replacement or, more graphically, as harvesting. But others analyzed the number of deaths over the following weeks and determined that there was no drop in the number of deaths, and thus those who died during and immediately after the fog were not harvested but killed.

Only after further agitation by anti-smoke factions and other civic groups did the government address the issue through the Clean Air Act of 1956. For the first time, regulations subjected domestic coal fires to controls, established an objective measurement for what constituted dark smoke, and empowered local governments to establish smokeless zones in their areas.

The British Clean Air Act of 1956, implemented slowly over a decade, significantly reduced smoke caused by domestic fires. For example, when smog covered London in December 1975, the peak concentration of smoke and sulfur dioxide did not exceed 800 micrograms per cubic meter and 1,200 micrograms per cubic meter, respectively, or less than 20-30 percent of peak levels during the 1952 fog. Besides prompting the Clean Air Act, the 1952 fog served as a catalyst for the study of diseases and deaths attributed to air pollution. Studies over the past fifty years have led to an increased understanding of how soot, fog, and particulate matter affect populations, especially in demonstrating the correlation between high concentrations of particulate matter and respiratory diseases and deaths. Recent regulation of ambient air quality standards in the United States grew out of this work. Based on more advanced research techniques, a recent reassessment of the effects of the 1952 fog estimates that as many as 7,000 to 12,000 deaths, not 4,000, resulted from the fog.

Though Londoners moved away from soft, high-carbon coal, to smokeless fuels, they also grew more reliant on cars for transportation. While catalytic converters have reduced emissions per vehicle, the number of vehicles in London has only grown, contributing significantly to the air pollution in the city. By the 1970s, domestic coal fires had receded as a pollutant, only to be replaced by vehicular emissions as the primary threat to the health and environment of London. Londoners solved one fossil fuel problem only to create another, relying less on dirty coal fires but more on dirty and dangerous oil-fueled cars.


[1] Quoted in William Wise, Killer Smog: The World’s Worst Air Pollution Disaster (New York: Ballantine Books, 1970), at 164-65.


from Robert Emmet Hernan, This Borrowed Earth: Lessons From The 15 Worst Environmental Disasters Around The World (PalgraveMacmillan, 2010).
Challenges to measuring climate “Loss and Damage”

Look to measuring Natural Resource Damage claims under the US Superfund law

The issue of climate loss and damage was center stage at the recent  UN climate Conference of the Parties (COP) 27.  Since the idea surfaced several decades ago that seems fair.  Yet getting a handle on what people mean by “loss and damage” in the context of climate change remains elusive.  There is no definition of the term provided in the UN IPCC process.

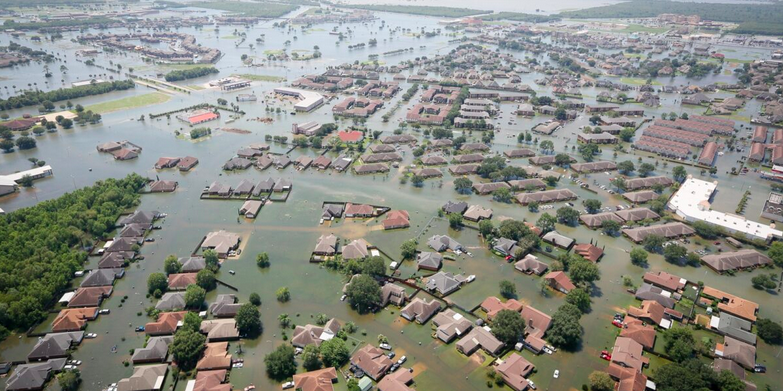
In general it refers to appeals by developing countries for the creation of a fund to compensate the most vulnerable nations for losses and damages associated with climate disasters.  It is understood that the fund would be paid for by the developed countries.  The rationale is that the poorer, developing countries suffer the most from the consequences of climate change, and they have contributed the least GHG emissions.  In contrast the developed, richer countries emitted the great bulk of the greenhouse gases that are responsible for these consequences, and their economies profited through the reliance on cheap fossil fuels for energy supplies.

A more direct, even blunt description of loss and damage is: “Finding a way to force high-income countries to produce some cash to help vulnerable countries manage the impacts of climate change…”  See Cuff.

Climate loss and damage has been called an important step towards justice, a moral imperative to act, a much-needed political signal, a political act.  But it has to function as a legally binding rule or regulation if it is to provide actual relief from climate breakdown.

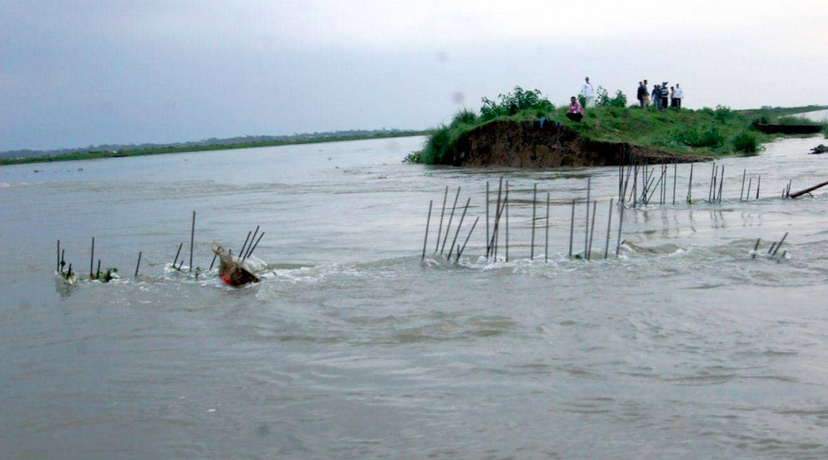
Photo: Sheikh Nasir


And there are challenging issues facing implementation of any loss and damage financing mechanism:

How much greenhouse gas has been emitted to the atmosphere so far?  Which countries released the most GHGs in the environment, over what periods, and which GHGs?

Which countries have suffered the most from climate change, over what periods?  What about future losses?  The fast developing science of climate attribution is turning out to be most helpful here, as solid science can now provide data showing how much climate change contributes to specific extreme weather events.

What are the actual losses and damages in question, and how do we measure them?  This issue presents perhaps the greatest challenge.

We can anticipate that the vested fossil fuel interests and responsible nations will attack any attempt to measure climate loss and damage, just as they continue to fight against eliminating fossil fuels.  They will claim that the issue is unproven by science, there is too much uncertainty, it will cost too much. That we cannot measure the impact of sea-level rise or loss of small islands.

We need to prepare for these attacks on valuation methods.  One productive source of support can be found in the US in the field of Natural Resource Damages under the federal Comprehensive Environmental Response, Compensation, and Liability Act (CERCLA or Superfund) and federal Oil Pollution Act (OPA).

“CERCLA provides a comprehensive group of authorities focused on one main goal: to address any release, or threatened release, of hazardous substances, pollutants, or contaminants that could endanger human health and/or the environment. CERCLA’s response provisions focus on the protection of human health and the environment. The statute also provides authority for assessment and restoration of natural resources that have been injured by a hazardous substance release or response.

OPA was enacted in reaction to the Exxon Valdez oil spill and provides authority for oil pollution liability and compensation as well as for the Federal government to direct and manage oil spill cleanups. Similar to CERCLA, OPA contains authorities to allow the assessment and restoration of natural resources that have been contaminated by the discharge, or threatened discharge, of oil.”

The measure of NRD damages under CERCLA and OPA is the cost of restoring injured natural resources to their baseline condition, compensation for the interim loss of injured resources pending recovery, and the reasonable costs of a damage assessment [CERCLA §§107 (a) (4) (C); 107 (f) (1); OPA §§1001 (5); 1002 (b) (2); 43 CFR §11.15; 15 CFR §990.62].  Governments and Indian tribes have standing to assert claims for NRDs.

There is an established body of academic and scientific research addressing the assessment of Natural Resource Damages (NRD), and there have been substantial settlements of such claims in litigation.

One method often used to quantitatively measure NRDs is contingent evaluation.  The method relies on hypothetical questions posed by surveys to ascertain how much respondents would be willing to pay to preserve the natural resources or to reduce the amount of injury to resources caused by the release or discharge.  See Contingent Valuation Method, below.

Here’s a brief look at one example that focused on recreational loss of a natural resource.  A state government filed a claim under CERCLA against a chemical corporation for releases of hazardous substances into the environment from its plant.  Part of the claim was for NRDs associated with the release.  The NRD claim was based on the discharge of a specific toxic chemical that migrated to one of the Great Lakes and polluted the Lake to the extent that state fish advisories were issued limiting fishing in the Lake.  The chemical company was the only company that manufactured the toxic chemical in the relevant area so its liability was clear and the only issue was the value of the NRD loss.

The government and company agreed to enter into negotiations on assessing the NRD.  The government developed a contingent valuation based on extensive research and surveys on how the public valued the loss of fishing services in the Lake.  The surveys provided data on how much the pubic had spent on fishing trips and how much less they would spend on visiting the area with the restricted fishing rights.  There were of course extensive differences and assumptions made in the surveys and affected population and other matters.  A settlement was finally reached and the company paid $12 million in NRDs, the highest such settlement in the state.   See Contingent Valuation Method, below for more examples of NRD claims.

Conclusion

We can expect entrenched, extensive lobbying and unlimited funds to attack losses associated with climate impacts, including such phenomenon as sea level rise and the destruction of small islands.  These attacks can be offensive.

When confronted with the threat that small island nations might be wiped out by sea rise, one George W. H. Bush administration supporter glibly suggested, “What’s wrong with a bit of sea level rise? It is merely changing land use–where there were cows there will be fish.”   Those whose lives and cultures will be destroyed by even a slight rise in sea level will think otherwise.  Note 1.

 While there are challenges in assessing climate loss and damage, there are also established models for such assessments.


Note 1.  R. Spradley, a former prominent member of President George H. W. Bush’s Commerce Department, quoted in Jeremy Leggett, The Carbon War (New York: Routledge Press, 2001), 119.


Sources:

“Loss and damage: A moral imperative to act”  An interview with Dr. Adelle Thomas, a lead author of the IPCC’s 2022 report on Impacts, Adaptation and Vulnerability, and the Special Report on 1.5°C.  UN Climate Action bit.ly/3XrOFL4

Madeleine Cuff, “ What is ‘loss and damage’ and how is it informed by climate science?  Advances in attribution science mean we can pin the blame for extreme weather on polluting nations, making the argument for climate reparations impossible to ignore New Scientist (14 Nov 2022). bit.ly/3i9hFqK

US EPA, Natural Resource Damages: A Primer bit.ly/3GMrwgC

Comprehensive Environmental Response, Compensation, and Liability Act (CERCLA or Superfund), 42 U.S.C. 9601, et seq., at bit.ly/3F1Ormy

Ecosystem Valuation, Contingent Valuation Method, ecosystemvaluation.org/contingent_valuation.htm  With several case studies of NRD claims.

Climate Change and Supply Chains

Turmoil

We learned a lot of lessons from the onslaught of the Covid pandemic, including how it disrupted global supply chains for countless products.  The disruption most often was the result of closures of plants and facilities because workers were getting the Covid 19 virus and spreading it to others.  The extraction of raw materials, the gathering or making of parts and elements for other products, and the production and distribution of final products were all subject to disruptions.  In China, whole cities and wider areas were subject to lockdowns, quarantines and closures.

All of a sudden we began to get a sense of what globalization of the world’s economies meant, including the highly efficient and low cost shipping of products and materials and parts across continents and oceans, and reduced inventories because of just-in-time production.  Even those areas that managed to control the spread of the Covid virus were often affected by shutdowns in distant highly contagious areas where sources of raw materials and parts or distribution were critical.

We also learned that white collar workers could work from home and maintain the flow of intellectual products without much disruption from the virus.

It’s not just viruses that cause such disruption.  War can do it as we are seeing in Ukraine.

And climate change is upon us.

Climate change affects production and distribution in different, more fundamental and complicated ways than the pandemic.  The consensus is clear that climate change is creating more, and more intense, extreme weather events, including heat waves, floods, fires, and hurricanes.   The extreme weather events do keep workers from their plants, as the virus did, but those events recede and workers can return to their plants.  Unless, of course, the plants themselves have been destroyed by the extreme weather event, in which case the interruption is extended or permanent.

Even if plants remain open the extreme weather can severely damage infrastructure, including streets, roads, rail lines, and airports, preventing movement of people and distribution of goods for extended periods of time.

Power for energy production can be widely and deeply impacted by fires, storms, and droughts.  Dry bodies of water cannot provide the water needed to cool nuclear power plants.  Hydropower also feeds chemical factories and coal-fired power plants.  Extreme events can disrupt transport of goods as when the Yangtze River in China and the Rhine River in Germany dried up enough to prevent the shipment of goods.  Droughts in the western US reduced exports of agriculture products.  Wildfires disrupted distributions from Amazon and others.  Winter storms caused power outages that shut down semiconductor plants in Texas, exacerbating shortages of computer chips globally.

Rising sea levels, from climate change, put many ports and bridges and other infrastructure at risk of severe damage or permanent destruction, with wide-spread impacts on trade.

And we are seeing that one extreme event, such as a drought, can be followed within a short time — maybe weeks or months — by a different kind of extreme event in the same locale, such as a flooding.

All of these disruptions to the supply chains need to be built into the equation when we estimate the costs of climate change.

With Covid 19 there is the expectation, or at least hope, that with vaccines and established means of reducing exposure through masks and social distancing it will diminish or go away.  There is no vaccine for climate change.  It is not going to go away.


Sources:

Lessons from the COVID pandemic for climate breakdown:  First of all, trust the scientists, in ieBLOG section of www.irishenvironment.com (July 2021).

Jacques Leslie, “How Climate Change Is Disrupting the Global Supply Chain,” Yale E360 (10 March 2022). bit.ly/3STol8Z

Declan Allen, “How supply chains and logistics get goods from A to B,” RTE (24 Jan 2020).   https://bit.ly/3Nk04YK

Ana Swanson and Keith Bradsher, “Climate Change Could Worsen Supply Chain Turmoil,” The New York Times (8 sept 2022).  nyti.ms/3SPPjOO


A Possible Tipping Point for Ireland

Changes to ocean circulations and colder weather ahead?

Tipping points can be tricky.  Literally, they represent critical points or moments “in a situation, process, or system beyond which a significant and often unstoppable effect or change takes place.”  Merriam-Webster.   The concept of a tipping point arises in analyses of conditions that potentially will affect climate breakdown.

From global climate studies generally, “we know that the earth has been slowly, gradually warming over a hundred years and more, but there are or may be turning points when greenhouse gases have built up so that the earth’s warming will have irreversible and drastic adverse effects.  Such irreversible effects include the melting of the North Pole’s sea ice, Greenland’s glaciers and the Antarctic ice sheets…”.   See “Tipping Point” in iePEDIA section of www.irishenvironment (1 April 2013), at bit.ly/3BM7TB4

Tipping points can be tricky because they undermine the notion of a clear, direct and slow linear change in the climate by showing that under certain circumstances changes can be sudden and abrupt and lead to irreversible changes.  We can prepare better for the slow linear changes a lot better than for the sudden and abrupt and possibly irreversible changes.

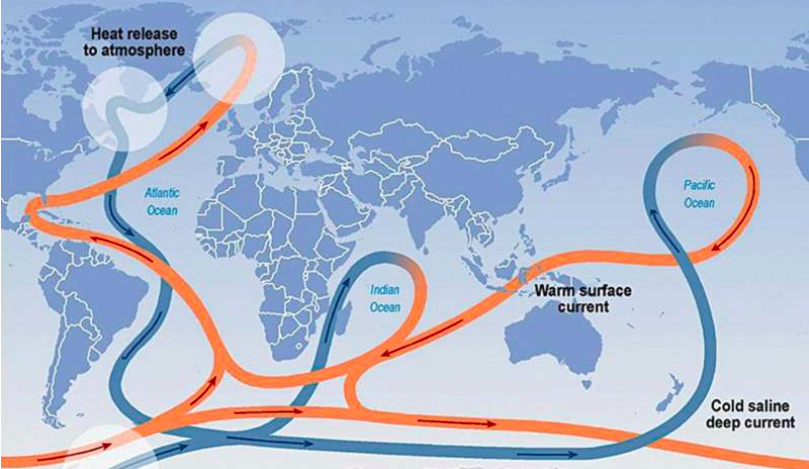
One condition that may be experiencing a tipping point is ocean circulations.  The weather in Ireland is affected in significant ways by the circulation of waters in the Atlantic Ocean, referred to as the Atlantic Meridional Overturning Circulator (AMOC), also sometimes referred to as the Atlantic Thermohaline Circulation (THC).  The UK Met Office describes the AMOC as:

 … a large system of ocean currents, like a conveyor belt, driven by differences in temperature and salt content – the water’s density. As warm water flows northwards it cools and some evaporation occurs, which increases the amount of salt. Low temperature and a high salt content make the water denser, and this dense water sinks deep into the ocean. The cold, dense water slowly spreads southwards, several kilometres below the surface. Eventually, it gets pulled back to the surface and warms in a process called “upwelling” and the circulation is complete.


That system accounts for the warm weather experienced in Ireland despite the fact that it is on the same latitude as Siberia.  If the AMOC weakens or is blocked, the climate in Ireland could turn much colder, not unlike the climate in Siberia.  If that happens then the Irish would need more than a few traditional Aran sweaters.  Moreover, the weakening of the AMOC could adversely, and significantly, affect monsoons and rain throughout India, South America and West Africa.

Is such a condition possible?  Likely?

In the Fourth Assessment of the IPCC on climate change in 2007 it is pointed out that, “The IPCC argues that an abrupt transition of the THC [now described as the AMOC], is “very unlikely” (probability <10%) to occur before 2100 and that any transition is likely to take a century or more.”  See Lenton et al, below.

But in the unfolding Sixth Assessment by IPCC (August 2021) it is reported that the AMOC has been weakening, with an almost total loss of stability over the previous century.  It is estimated that the tipping point for AMOC becomes possible with a 1.5°C rise in global temperatures and that the tipping point may be only 50 years away or sooner.

While the exact moment for any AMOC tipping point remains uncertain, “there is an urgent need to act in order to reduce our GHG production. It is also becoming clearer by the day that there is a real need to encourage preparedness and resilience building across countries that would be the most heavily impacted by such an event.”  See Emmanuel Rivera, below.

Certainly Ireland needs an assessment of the balance of the rising temperatures from global warming and the cooling from any weakening or collapse of the AMOC in order to develop a resilient future.


Sources:

“Tipping point.” Merriam-Webster.com Dictionary, Merriam-Webster, www.merriam-webster.com/dictionary/tipping%20point. Accessed 22 Sep. 2022

“What is the Atlantic Meridional Overturning Circulation?” UK Met Office bit.ly/3dTfg1O

Timothy M. Lenton et al., “Tipping elements in the Earth’s climate system,” Proceedings of the National Academy of Sciences (PNAS) (12 February 2008).   https://doi.org/10.1073/pnas.0705414105

David I. Armstrong McKay, et al., “Exceeding 1.5°C global warming could trigger multiple climate tipping points,” Climate Tipping Points (Sept 2022). bit.ly/3BPJ9YJ

Damian Carrington, “World on brink of five ‘disastrous’ climate tipping points, study finds,” The Guardian (8 Sept 2022). bit.ly/3quthph

Extreme Weather Events Are All the Rage: A European/ Norwegian Study in Reports section of www.irishenvironment.com (1 May 2018).

Sam Starkey, “An ocean current keeps Ireland warm.  What could happen if it collapses,” Green News (11 August 2021).  greennews.ie/amoc-explainer-2021/

Emmanuel Rivera, “Climate change tipping points: a look at the case of the AMOC,” Pilot4DEV (9 August 2022).  https://bit.ly/3y1UZOd

See “What Will Earth Look Like When These 6 Tipping Points Hit?” in Podcast section of new October issue of www.irishenvironment.com

Health Effects of Extreme Heat Events

We are learning more about the details.

Over the past several decades people have been complaining about the increasing incidences of extreme heat, almost no matter where one lives.  Such events present risks to people trapped by the heat, the greater risks typically affecting those with fewer resources.  Those who can afford air conditioning, in places where air conditioning is available, can escape the heat for periods of time, although the drain on energy resources also generates more greenhouse gases, and more heat, in a vicious cycle.  Even escaping by travelling to cooler places, if that is possible, strains energy resources.

Health and related organizations, including the US Center for Disease Control (CDC), define “extreme heat events” as several days or longer with unusually hot weather conditions that can harm human health.  The harms include rashes, cramps, heat exhaustion, heat stroke and complications of existing health conditions leading to increased hospitalizations.  Of course, death is the ultimate harm. In the US, extreme heat was the leading cause of weather-related deaths from 2000 to 2009.  And as the result of an extreme heat event in Europe in 2003, 14,800 people died in France alone.

The most recent projections of the effects of climate warming indicate that extreme heat events will last longer, be more severe and more frequent over the coming decades.

As a result recently there are more studies identifying the specific health risks that we are subjected to in extreme heat events and the size and composition of the affected populations.  Since the events are predicted to be on the increase, it makes sense to understand what awaits us and how we can manage the risks, and protect those most vulnerable.

One difficulty is that getting solid, reliable data from those in the developing world, who are already suffering from the events more than others, is challenging because of the lack of resources.  As a result there are not enough studies of those living full time in a warmer, even sizzling world, in contrast to those suffering from an occasional scorching summer.

What researchers are learning is that in steam-bath conditions our bodies absorb heat from the environment faster than we can sweat to cool off.

We are also learning that heat stress is affected by many conditions, including humidity, sun, wind, hydration, clothing, and physical fitness. So predicting how people will handle extreme heat is not an easy task.

Studies reveal that heat victims often die alone in their own homes, often from heat stroke, cardiovascular collapse or kidney failure.  Harms are greater in the very old and very young, and in people with high blood pressure and asthma.

Some studies from developing countries are emerging.  Such studies have shown that heat reduces efficiency at work as a result of impairment to thinking and motor functions.  In India, studies of workers in steel plants, car factories and brick kilns showed increases in kidney stones from severe dehydration.  The heat also aged some workers.  In Kenya, pregnant women carry water for their families, often after long walks in intense heat, resulted in preterm births and underweight babies.  In one study, the women carried newborns on their backs during these walks, causing the babies to develop blisters on their bodies.

Some are studying ways to counter the heat when air conditioners are not available or affordable.  One study is testing low-cost ways to make garment workers safe with green roofs, electric fans and scheduled water breaks.  Such real-world testing expands what we know from controlled laboratory settings.

The heat effects will intensify as global warming does, and will be exacerbated by two non-climate developments.  First is the aging population throughout the world, as older people are more vulnerable to heat effects.  And second is the more intense urbanization that is occurring with close to 50% of global populations in urban areas and with expectations that will rise to 70% by mid-century.   Urban heat islands are filled with concrete and asphalt and little vegetation, and with canyons of taller and taller buildings where air does not flow much.


Sources:

Raymond Zhong, “As Temperatures Rise, Scientists Are Studying How Humans Will React,” The New York Times (14 June 2022).

CDC, Climate Change and Extreme Heat Events bit.ly/3R